Product for AI team analytics
Zest
2025–2026
- Role
- Product and brand design, front-end build
- Timeline
- Multiple phases, 2025–2026
- Platform
- Web app · Browser & VS Code extensions · CLI · Marketing site
- Stack
- Figma · Astro · React · Tailwind · Claude Code
“Man is a legend. As long as we're iterating on these apps, I'm happy to keep going with him. You're crushing it.”
Client feedback
Live product
meetzest.comDesigned the app and the marketing site, then shipped the landing to production myself with Claude Code. As on any client engagement, final calls on look-and-feel sit with the client.
Zest is an AI-analytics platform for engineering teams. It tracks how developers use AI coding agents across the IDE, browser and CLI, and turns that into adoption metrics, leaderboards and an honest read on ROI. I owned the design end to end: brand, marketing site and the v4 product interface.
Overview
Teams spend real money on AI coding tools but can't see what's used, what works, or whether the spend pays off. Zest adds a privacy-first analytics layer over that. The job was to take a heavy, abstract product and make it readable, then help ship it.
9
landing sections redesigned
12
state interactive hero
−87%
hero image weight (PNG→WebP)
~5 days
design to shipped site
The problem
Engineering leaders had no way to measure AI adoption. Their dashboards showed what developers shipped, not how they worked with AI, and that's where the productivity story actually is.
The concept was abstract on top of that: a "5 levels of AI maturity" model that spans individuals, teams and the whole company. The old marketing site was a generic SaaS template and told none of that. Three audiences (developers, team leads, executives) all had to see themselves in one product.
The solution
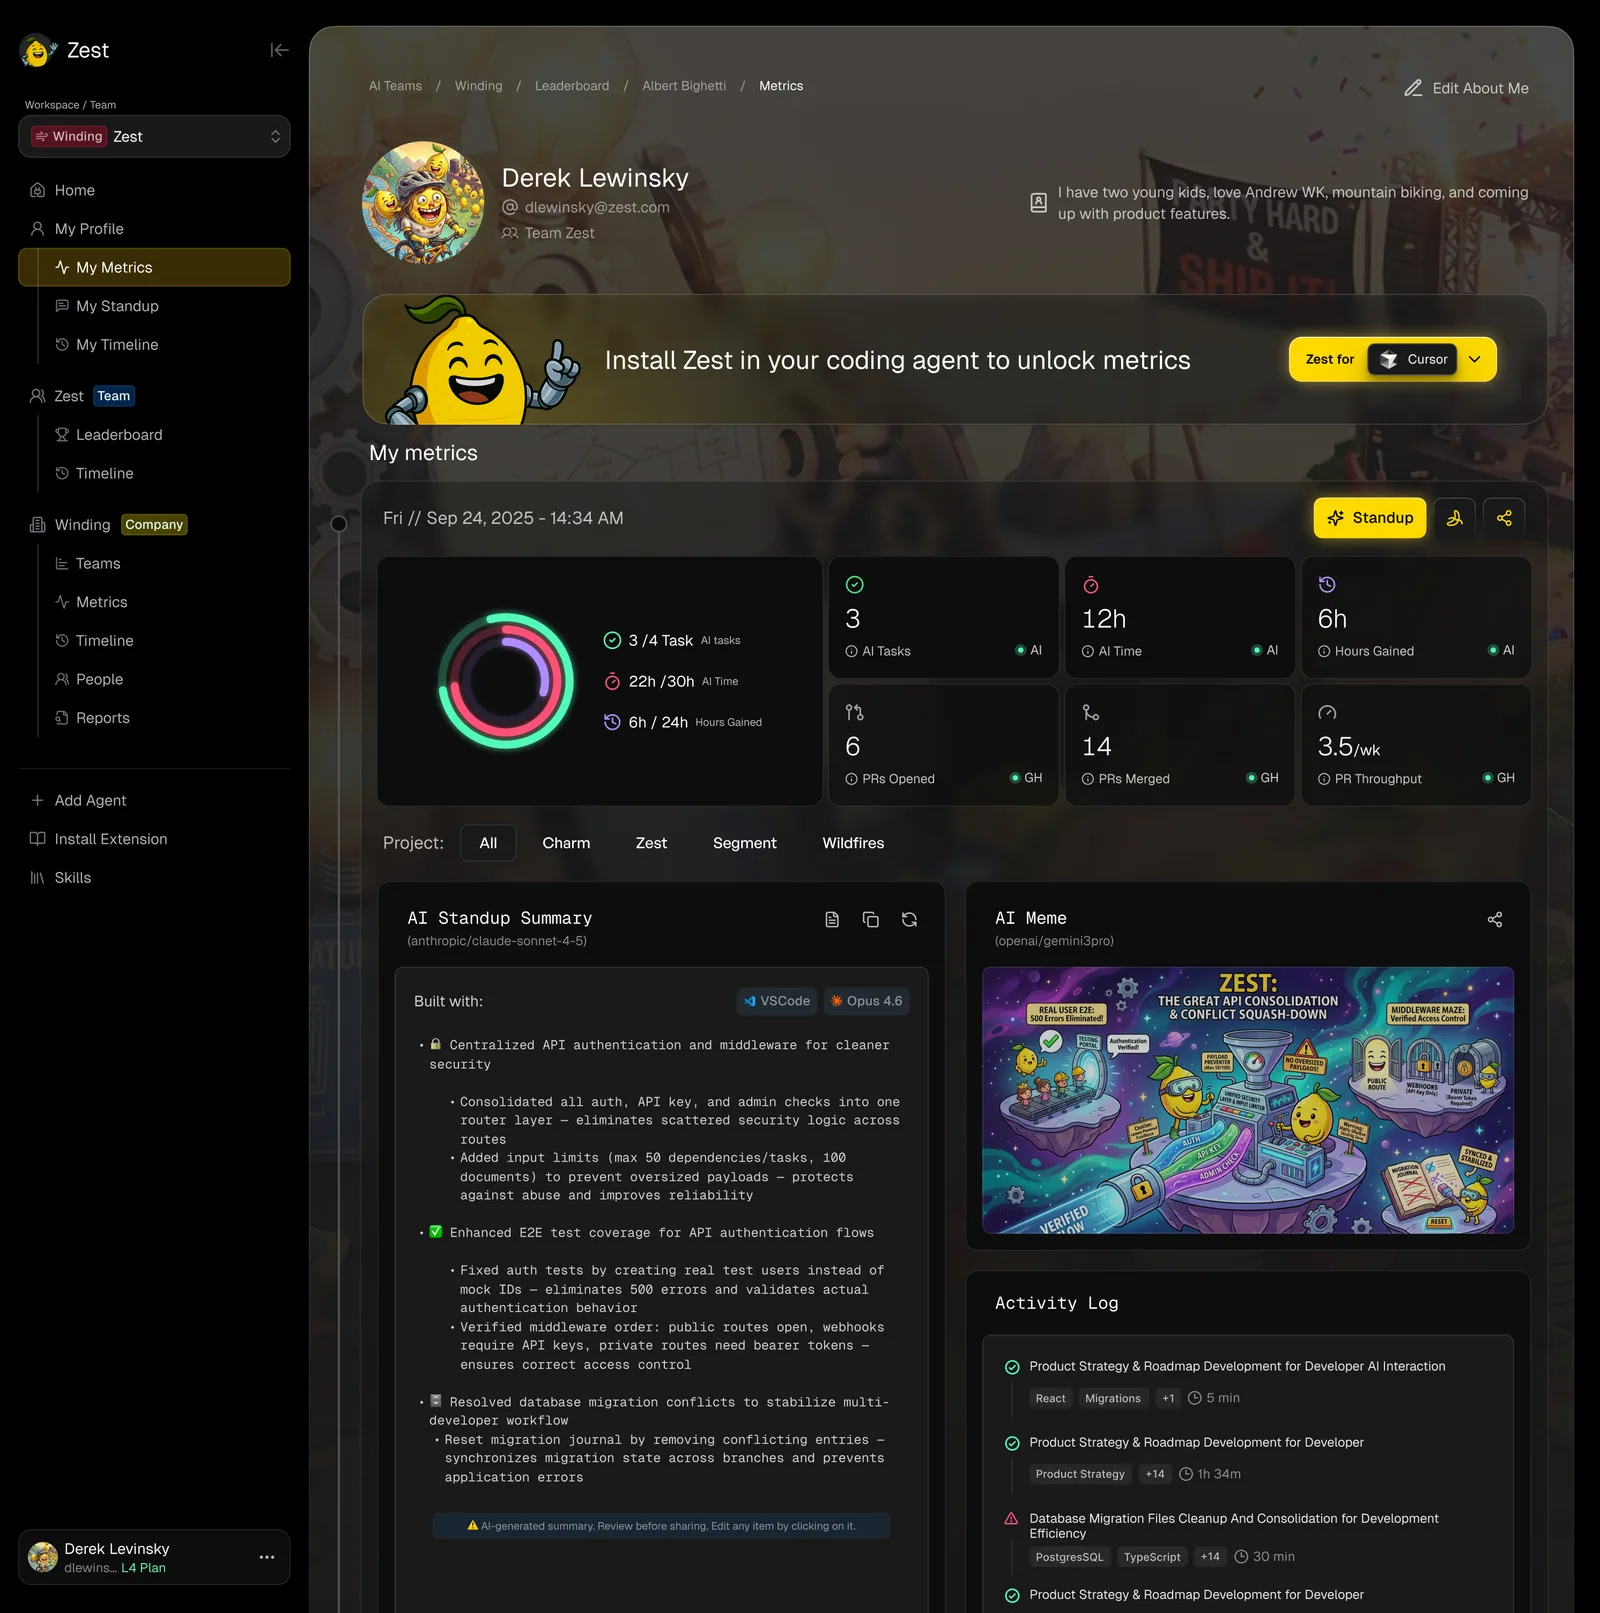
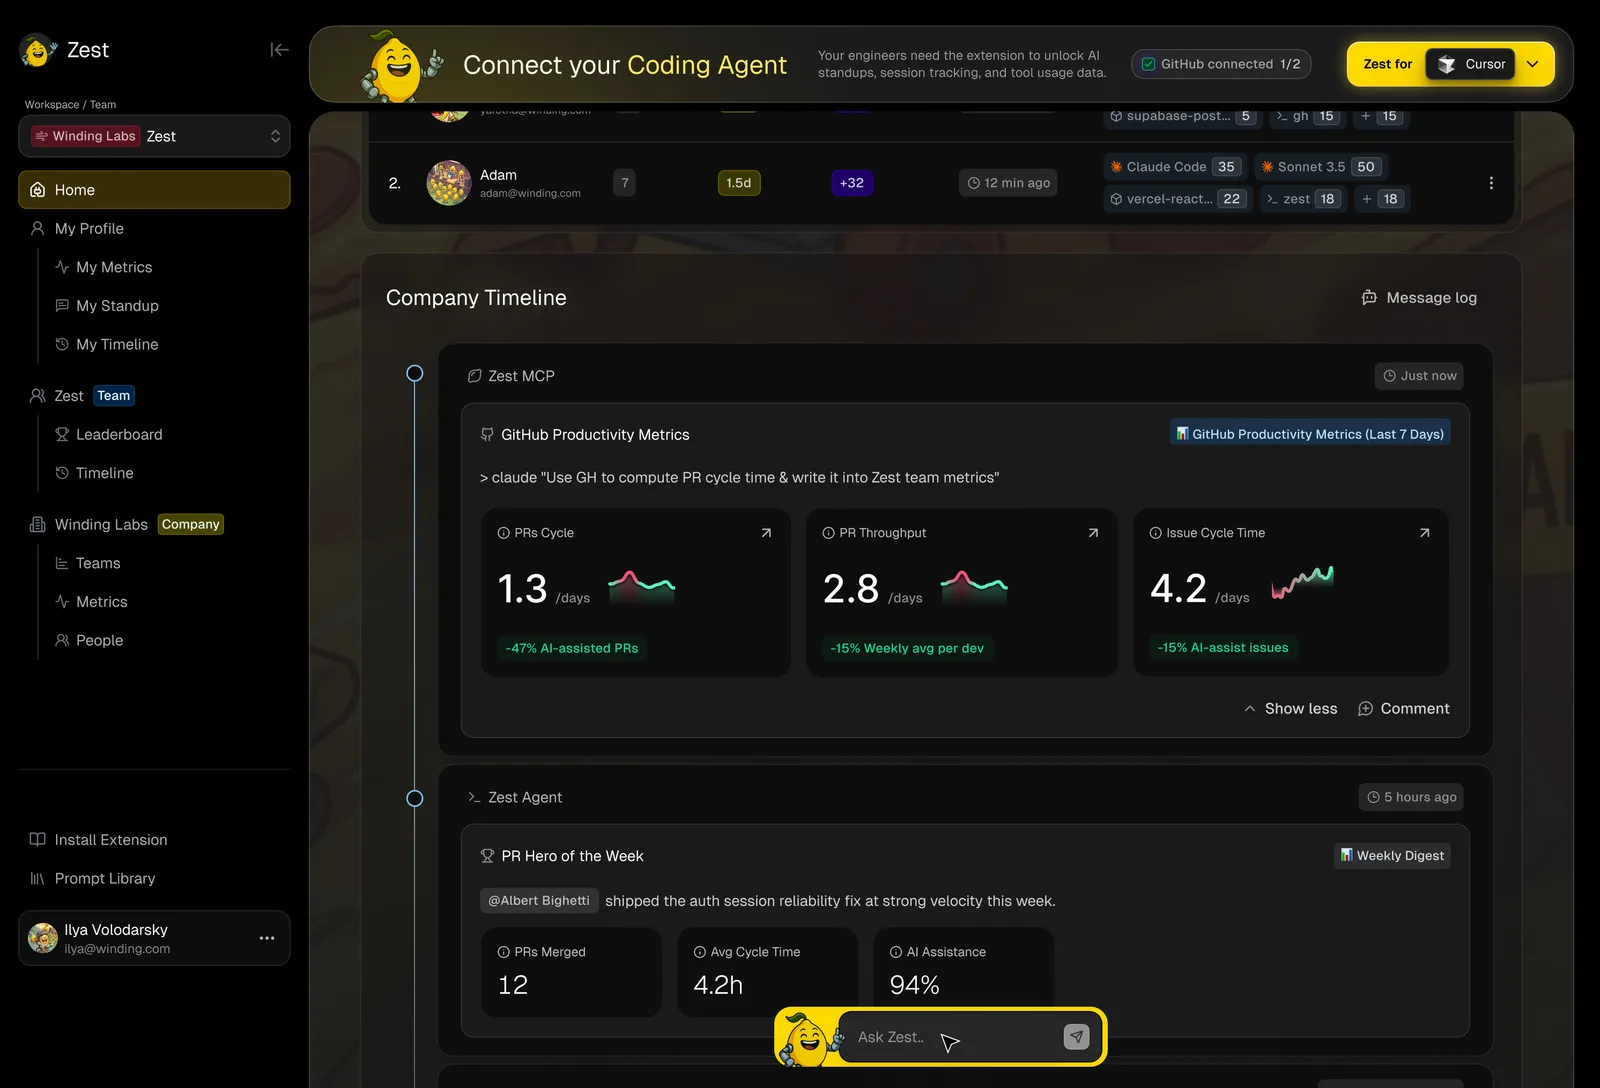
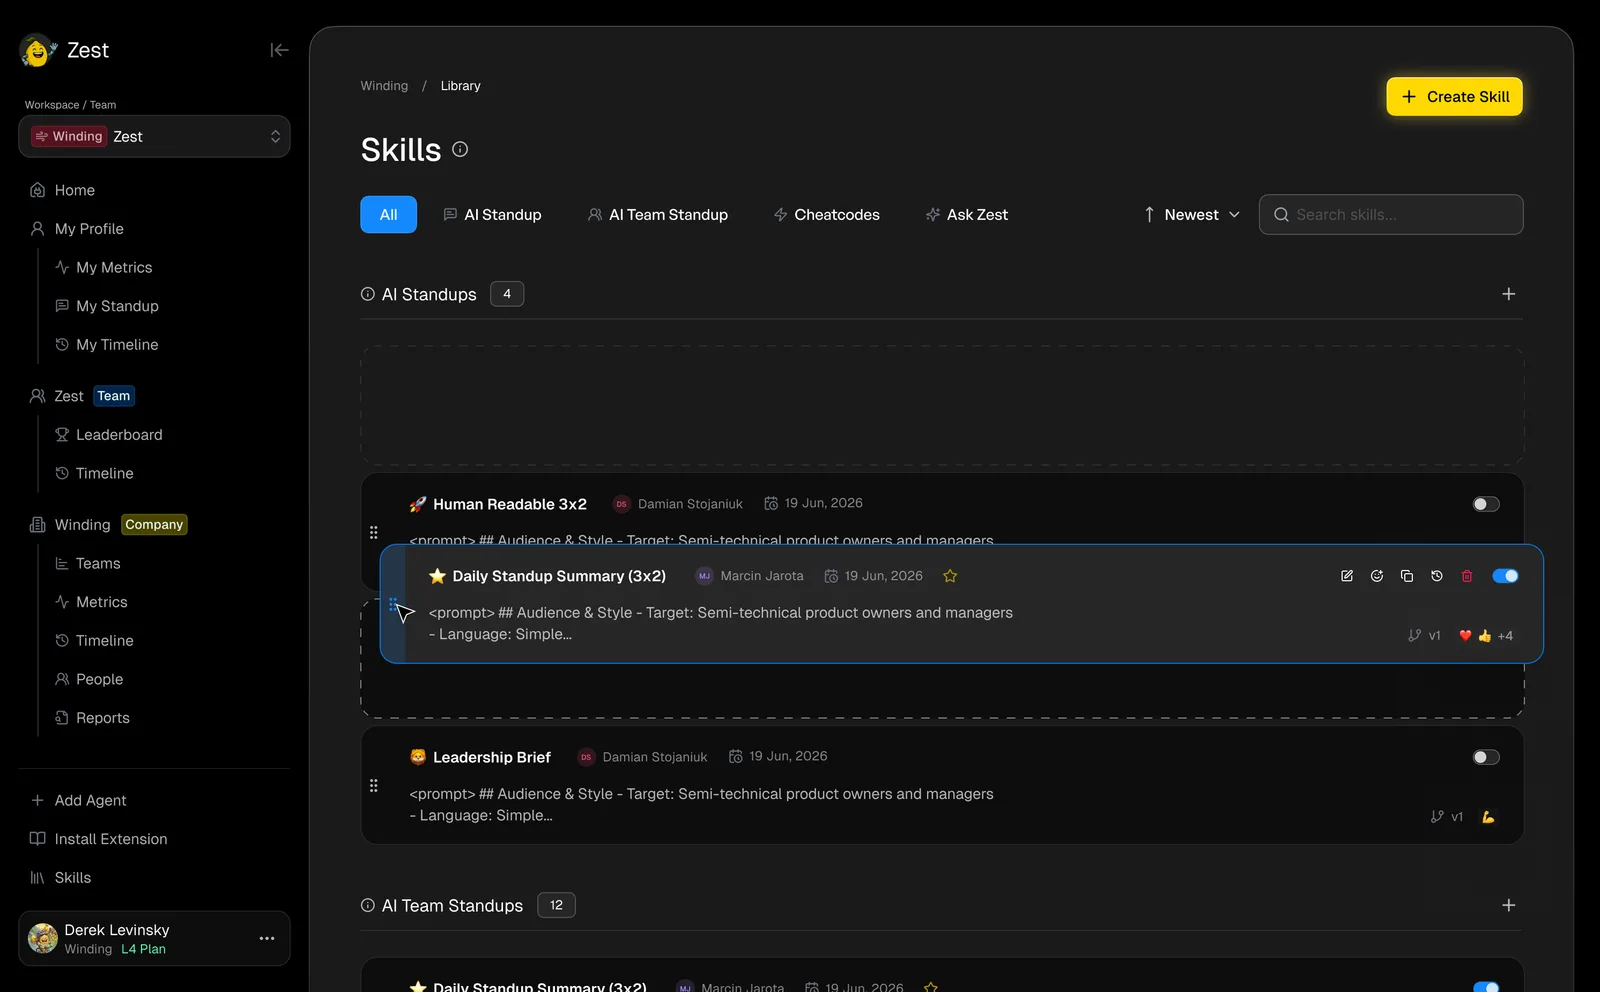
I built the product around one idea: your AI Toolkit. Developers see their own tools, skills and agents first. Team leads get leaderboards and AI standups. Executives get adoption trends and cost governance. One visual language whether you're reading your own week or the whole company's spend.
For the marketing site I turned the "5 levels" framework into an interactive product story, then built the whole thing myself in Astro, React and Tailwind with Claude Code as a pair-programmer. Nothing got lost between Figma and prod because I wrote both sides.
Design → production
I built a small in-browser dev tool to crop and pan the hero imagery by eye instead of guessing coordinates, tuned the page for LCP with lazy-loaded WebP, and went through 35+ preview deploys in under a week without touching the client's production infrastructure.
Screens and flows
What I designed
AI Toolkit dashboard
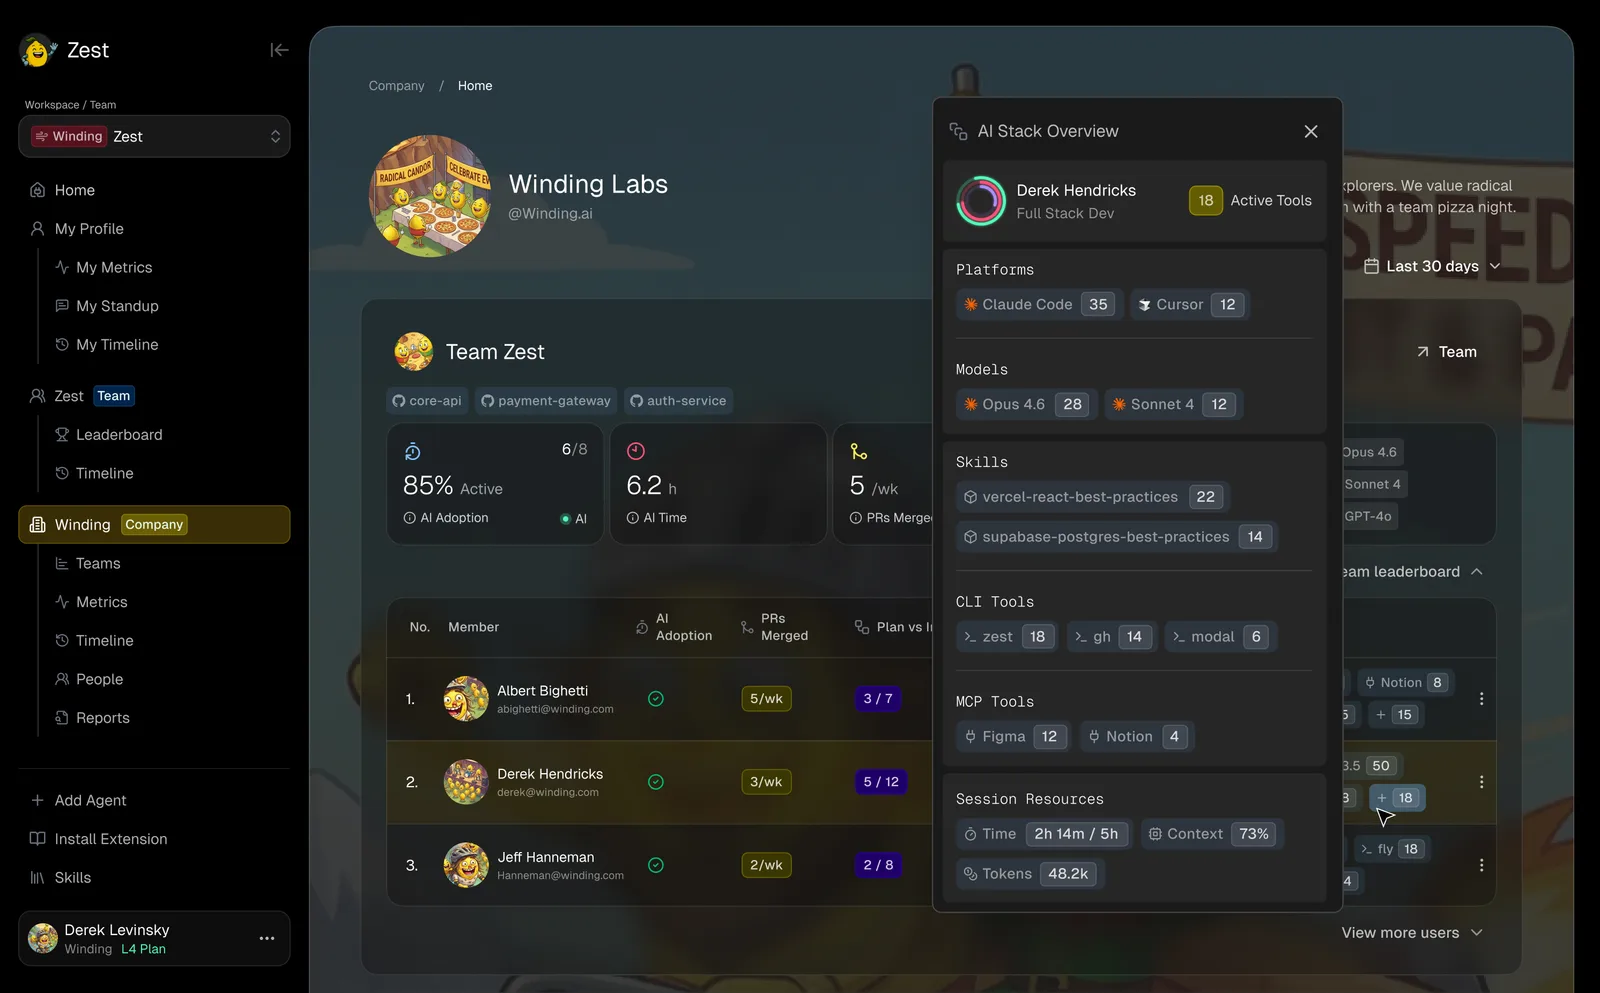
Per-developer view of skills, MCP integrations and agents with usage counts. Detail stays hidden until you ask for it, so the first screen doesn't drown you.
Team leaderboards and AI standups
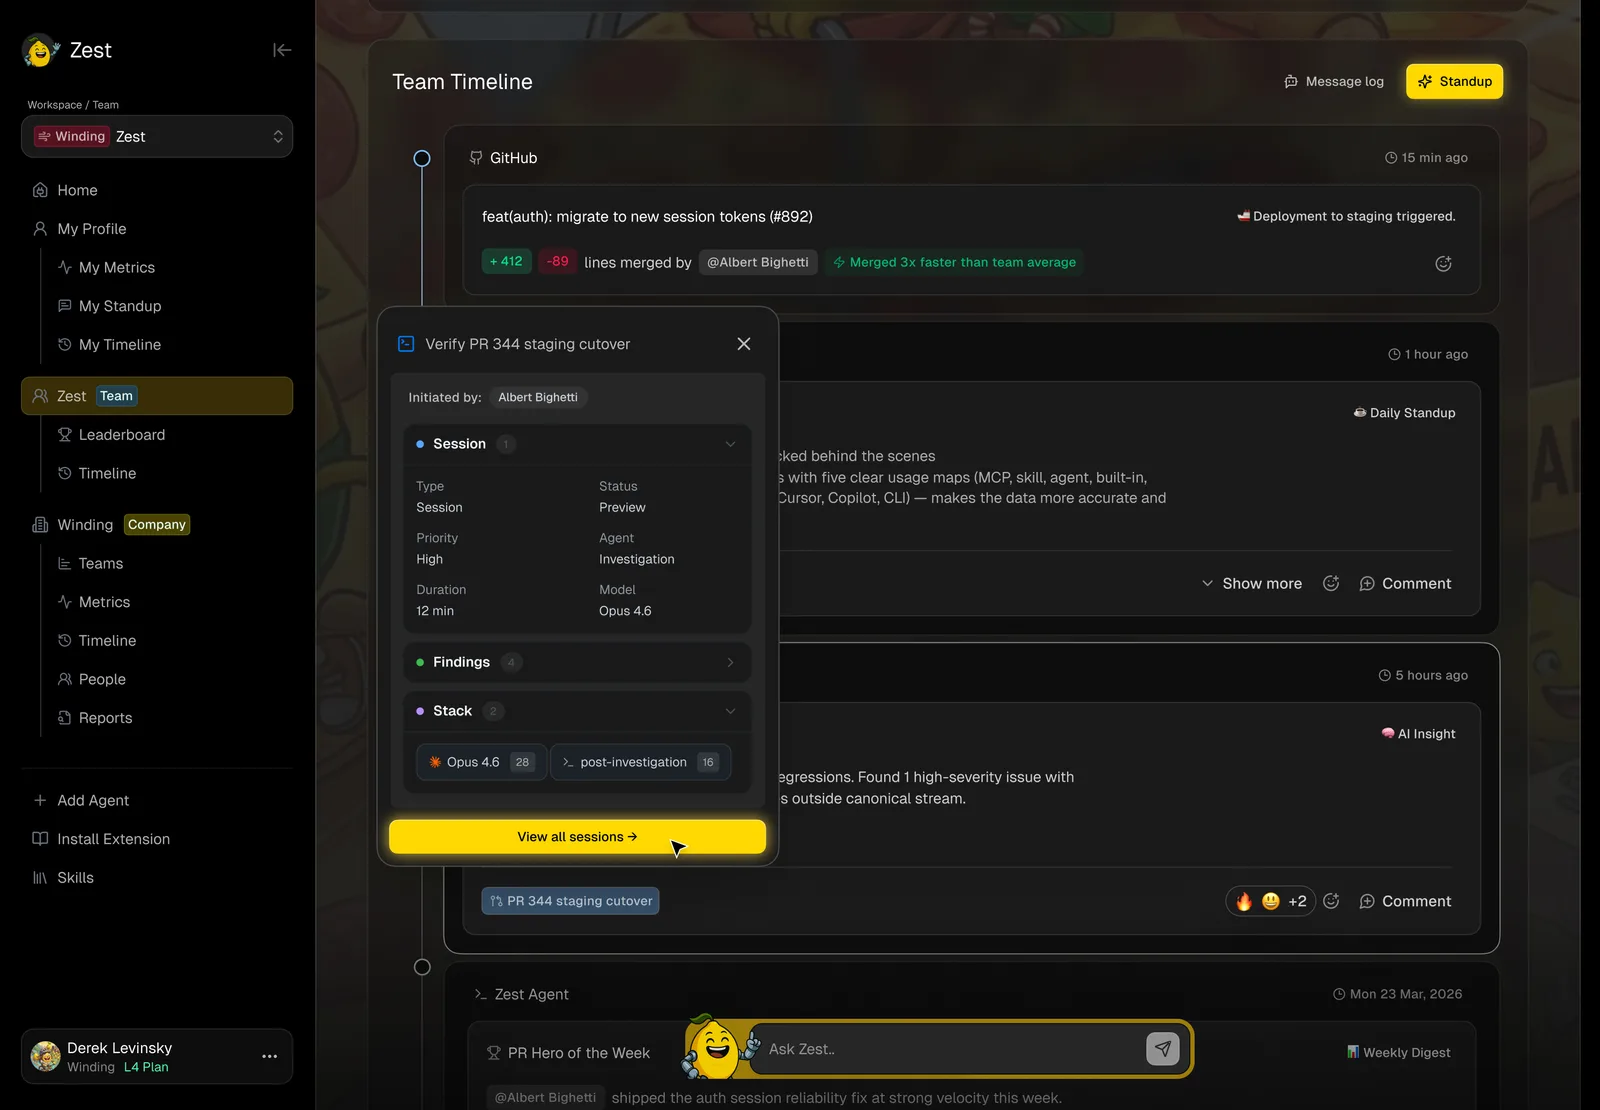
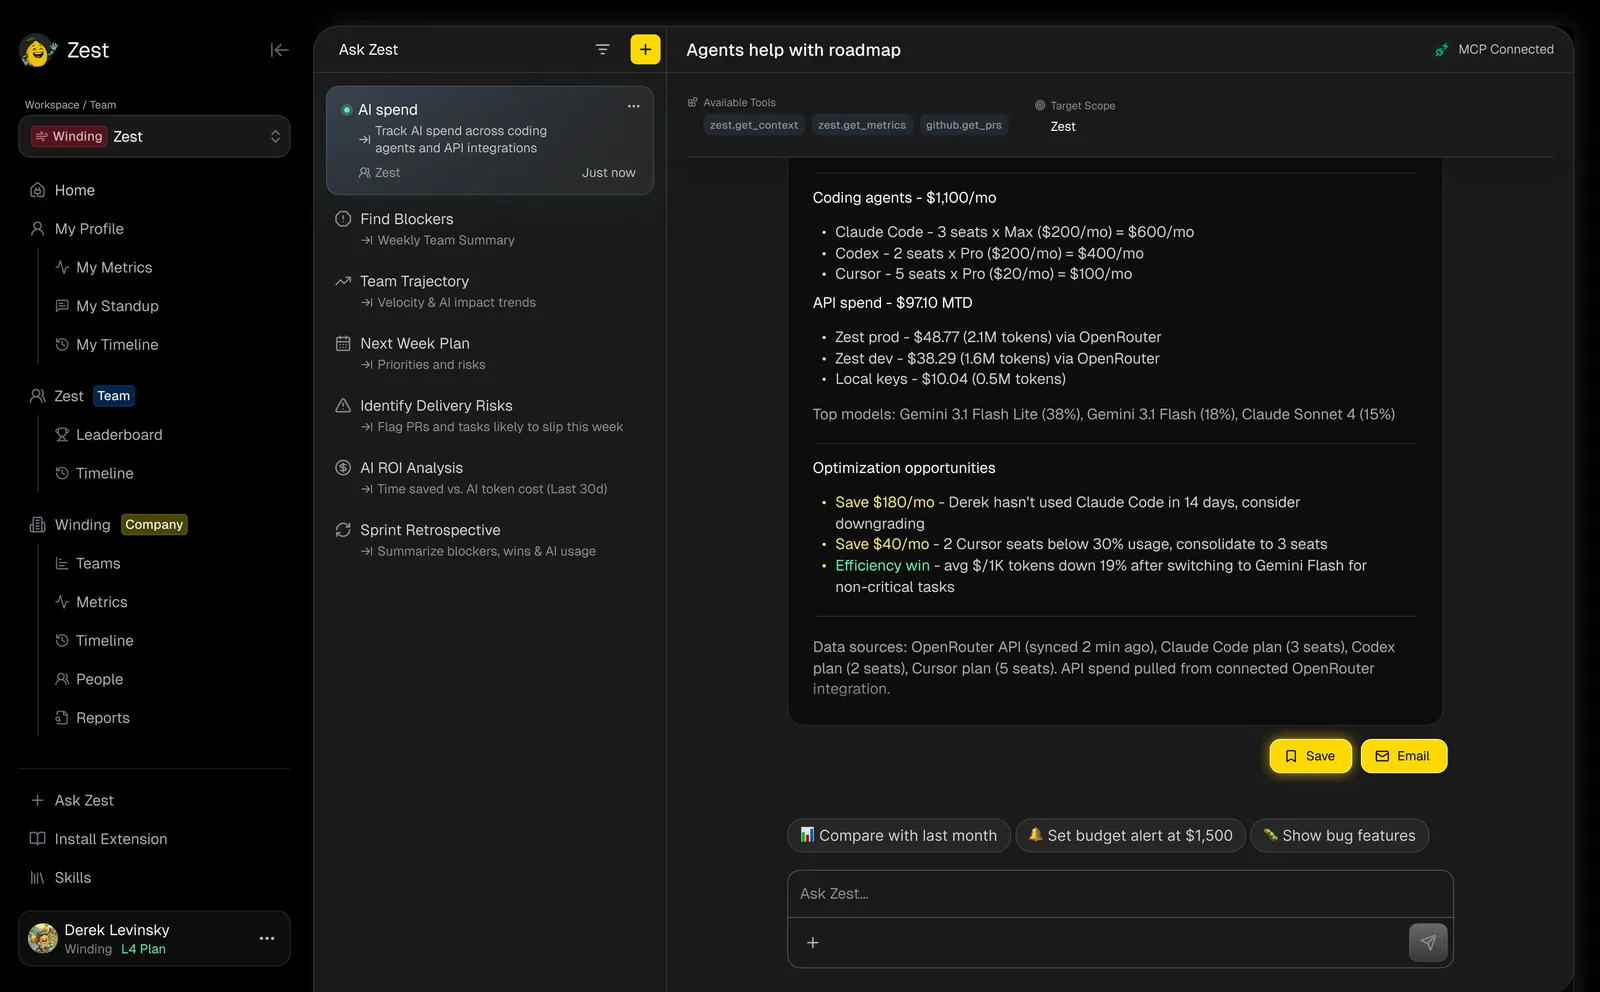
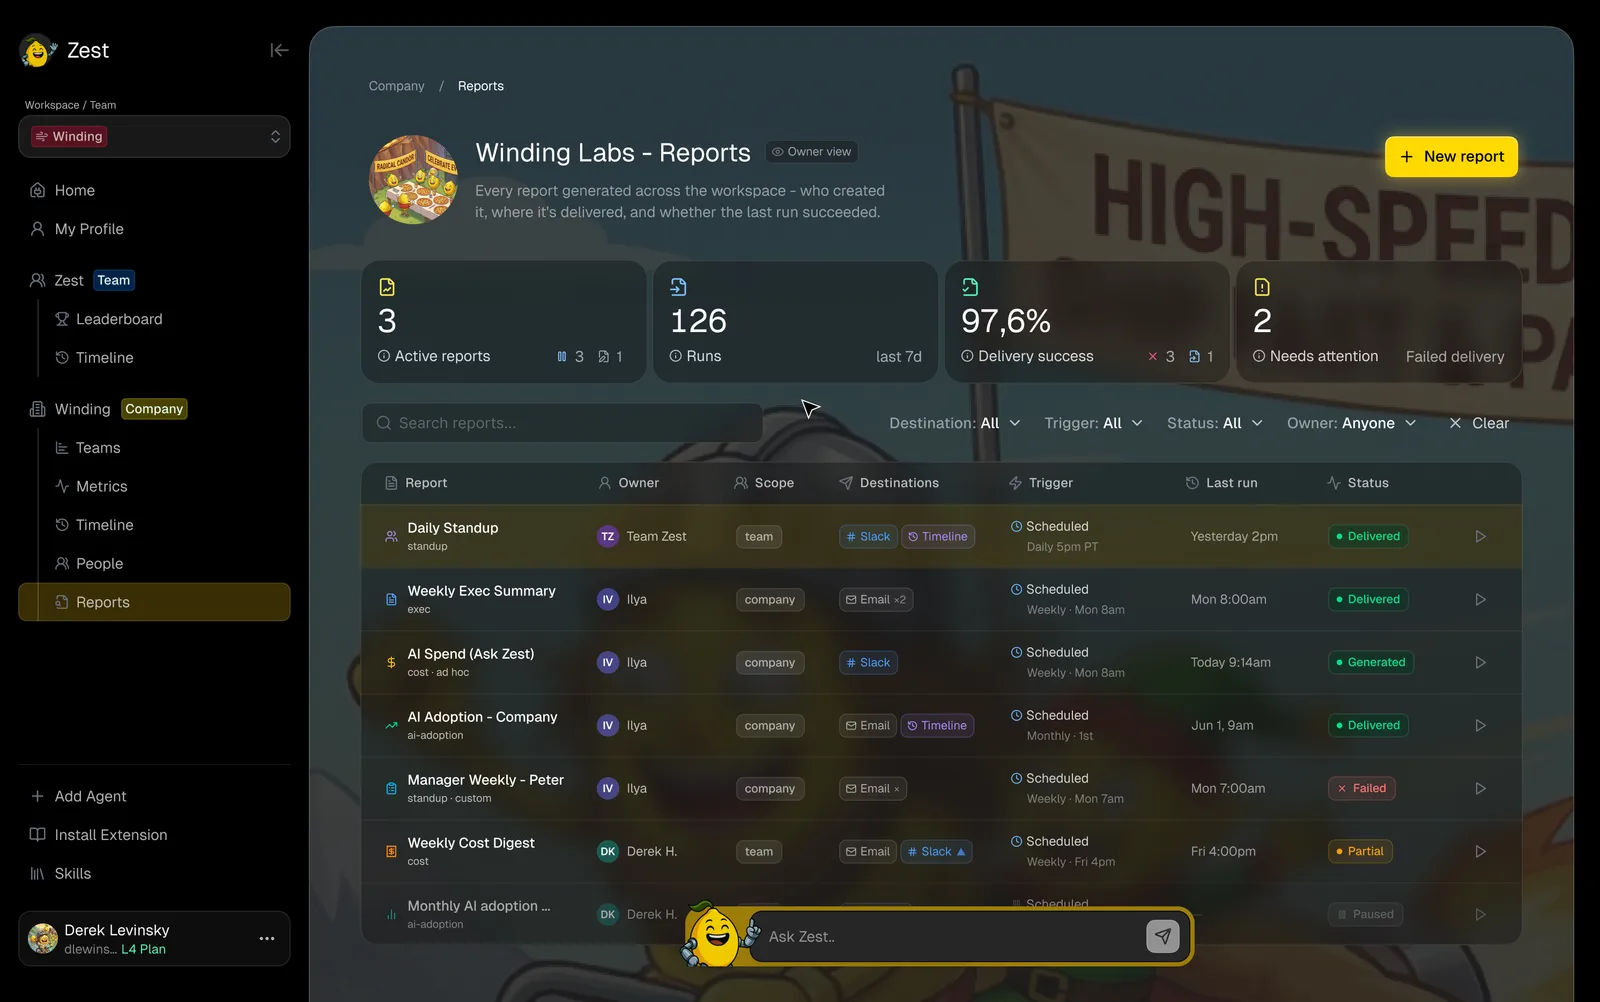
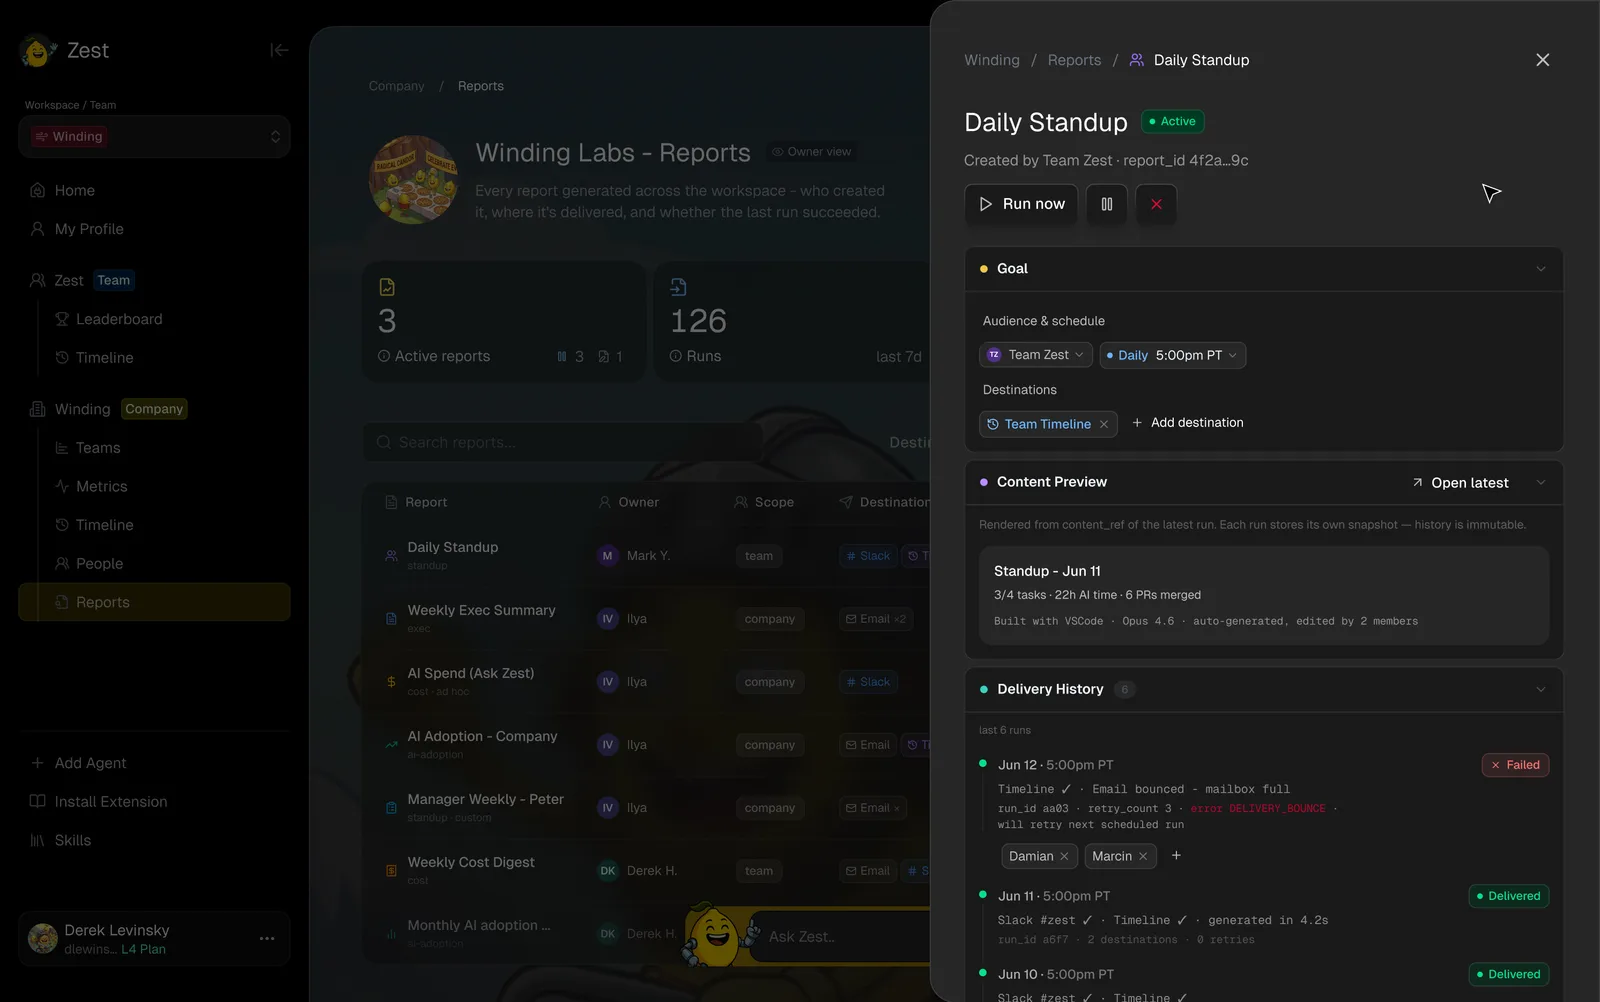
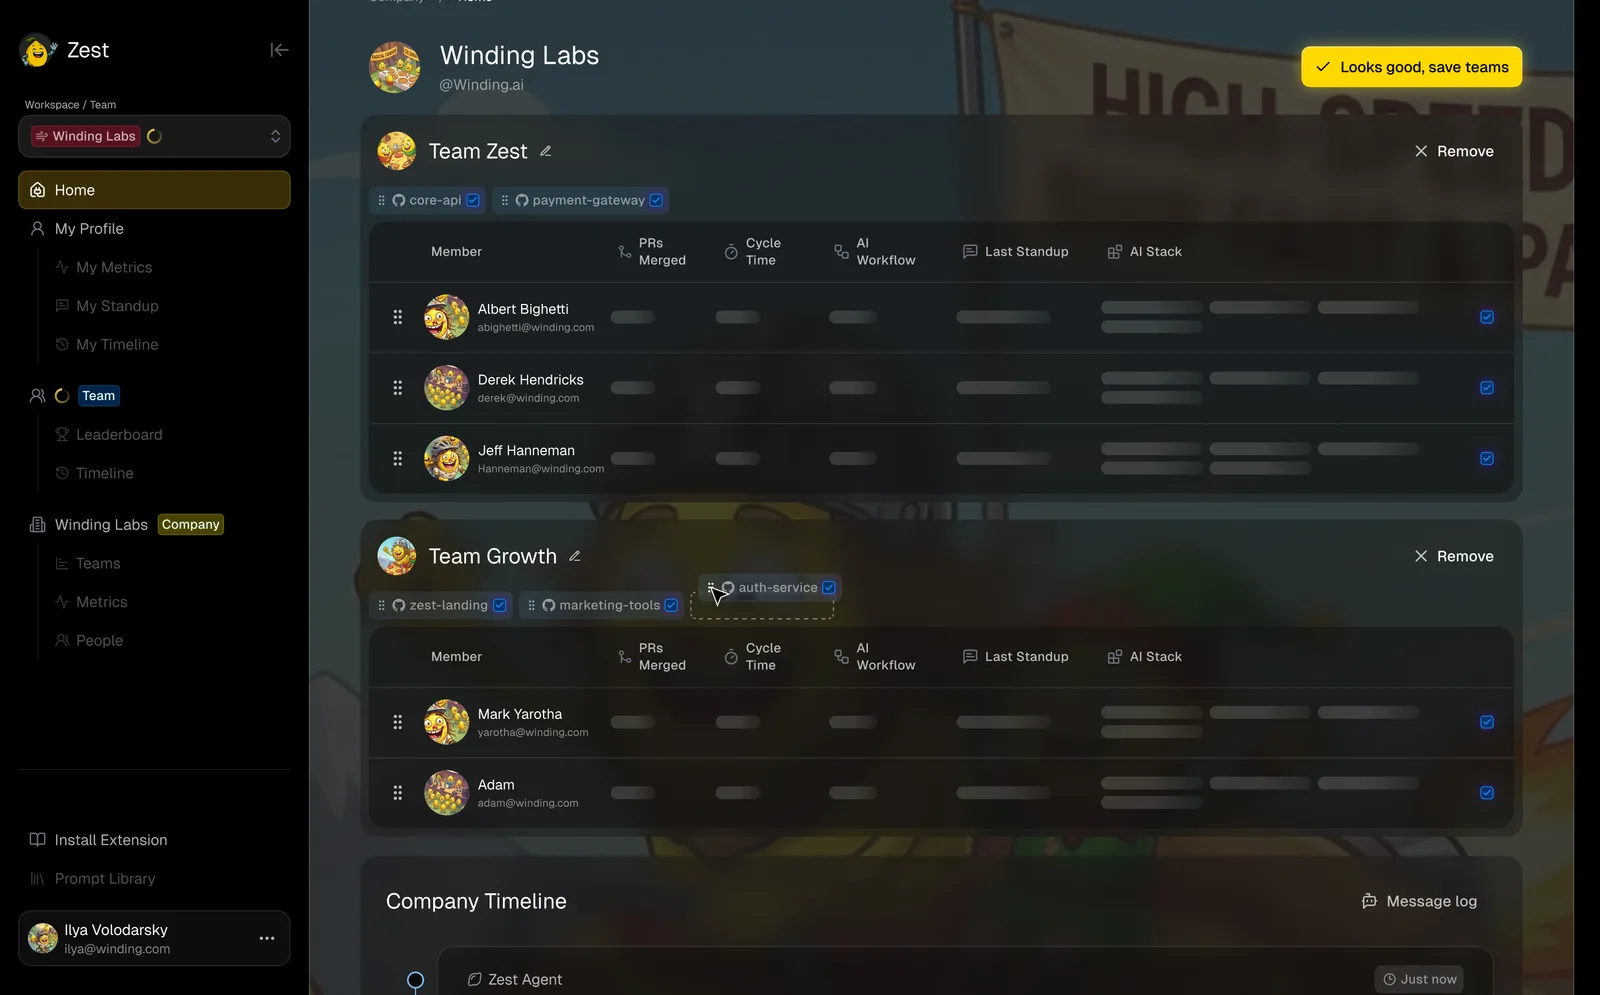
Ranked adoption, stack and workflow scores, plus auto-generated standups a lead can read in the two minutes before a call.
Cost and token governance
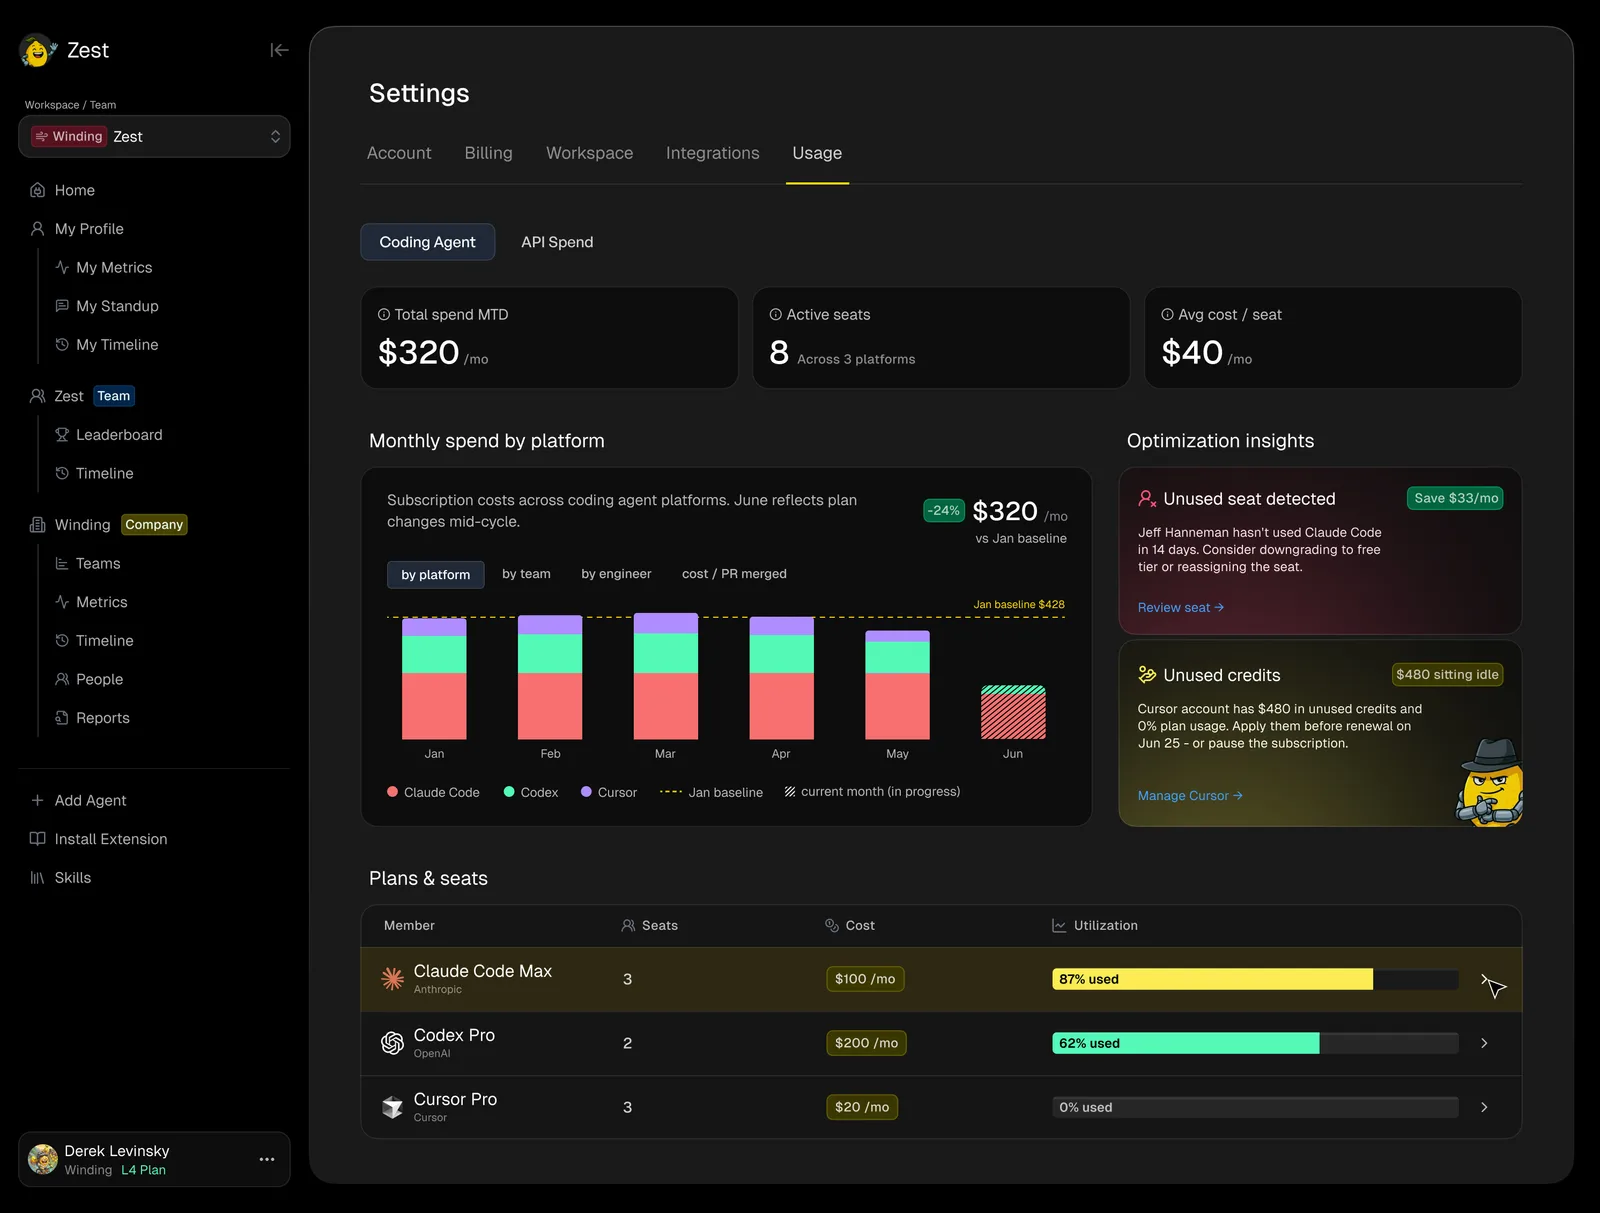
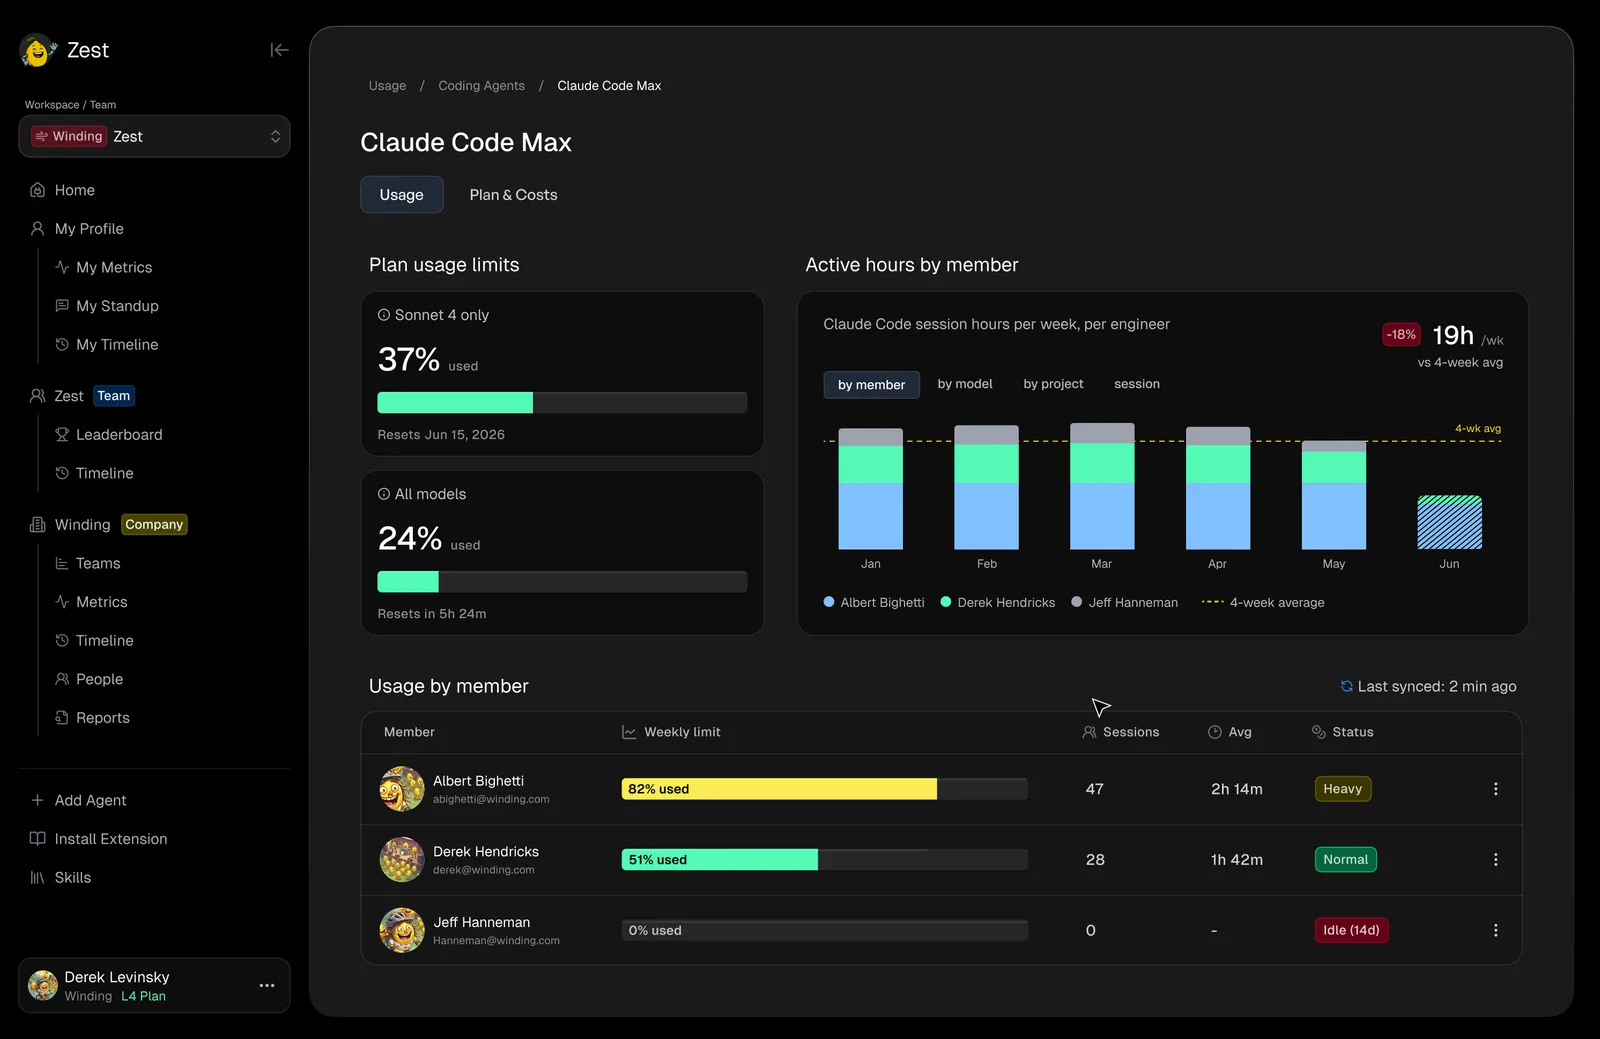
Spend-by-platform charts, seat utilization and optimization tips that give executives a real ROI story for their AI tooling.
Cross-surface design
One identity across the web app, a VS Code side-panel and a Chrome command-menu. Same product, several ways in.
Keywords
Next project
ePlan · An AI-native NEPA workspace